The information conveyed in a real estate market analysis should provide data necessary to fully understand the location and market dynamics. One of those components is an analysis of the economic and industrial core of a location. The primary industries of an area determine the supply and demand conditions for specific types of real estate as well as the economic growth prospects for the area. As a result, the real estate market analysis typically includes some model of the economic growth potential for the major industries driving the population and income for the area. One of the common models for economic growth is shift-share analysis. In this article we’ll discuss shift-share analysis in depth and also walk through an example step by step.
What is Shift Share Analysis?
Shift-share is a standard model for regional analysis that attempts to determine how much of a region’s growth can be attributed to national economic growth trends and how much can be attributed to unique regional growth factors. The goal of shift-share analysis is to separate the national level economic components from the regional industrial and economic effects. In essence, shift-share analysis explains why regional economic conditions may differ from national level trends.
The shift share model assumes that employment growth over a specific period of time for a specific community can be explained by three things:
- The national growth over the same time
- The community’s industry mix
- Employment shifts into or out of the community
This is summarized by the shift share formula:
Actual Growth = National Growth + Industry Mix + Regional Shift
Let’s discuss each of these components in more depth.
Shift Share Components
In order to understand and predict future growth patterns, shift share analysis examines how recent regional economic trends relate to national level trends across a time period. So, shift share analysis involves a form of regional sensitivity analysis to trends in the broader economy based on specific industrial or occupation components. Shift share analysis can consider growth effects based off percentage change in production dollars or in individual job creation. Here are the specific components in the shift share analysis.
National Growth Effect
The national growth effect explains how much economic growth in a region can be attributed to overall growth rates in the national economy. All things being equal, if the national economy is growing at a rate of 3%, generally that should be distributed across the entire country. On average, a region could also expect economic growth of around 3%.
Industrial Mix Effect
The industrial mix effect represents the portion of a region’s growth that can be attributed to that industry’s national level growth. The industrial mix helps to distinguish high-growth regions from low-growth regions based on the underlying growth rates of the region’s largest industries. To calculate the industrial mix effect, you subtract the national economic growth rate from the national growth rate of a specific industry. Then, apply that difference to the given industry’s proportion of economic activity in the region.
For example, consider that the national growth rate of a particular industry is 8%, and the national economic growth rate is 3%. That means 5% of growth can be attributed to the industry outside of the larger national growth rate. If this industry comprises 10% of economic activity in a region, the industry should create 0.5% growth in the region. The total expected rate of change in the region’s economy is simply a sum of the national effect and the industrial mix effect.
Regional Competitive Effect
The regional competitive effect is perhaps the most interesting and useful component in the shift share analysis. Regional competitive effects represent the unique advantages a particular region has in a given industry. Sometimes a region’s growth in a given industry outpaces both national economic growth trends and national level growth trends for the industry. This behavior indicates that there is something unique about the region causing it to experience a regional competitive effect in that industry. Regional competitive effects can be generated by factors such as geography, legislation or regulation, population characteristics, or natural resources.
A regional competitive effect exists where growth in a particular industry cannot be explained by overall national economic growth or growth of a particular industry at the national level. Consider the example above where the national economic growth rate is 3% and a particular industry grows at rate of 8% at the national level. There is a 5% growth rate attributed solely to the industry. However, you may look at growth of that same industry within a particular region and find that the growth rate was 10%. After subtracting the 3% overall national economic growth rate, there is a 7% growth of that industry in the given region. This is 2% higher than the national industry growth rate and therefore indicates a positive regional competitive effect in the region for that industry.
Industries in a region that are growing at a rate higher than the national average for that industry are called leading industries. On the other hand, industries in a region that are growing slower than the national average for that industry are called lagging industries. Economic development and planning professionals along with real estate developers should pay careful attention to these regional competitive effects and what factors may be attributed to their success or failure. In general, it is a best practice to focus future development funds into industries that have high growth potential due to a regional competitive advantage.
Using Shift Share Analysis
Shift share analysis is helpful when considering future supply and demand conditions for real estate in a region based upon economic growth prospects. For example, you might see that the health care industry is growing in your area and consider the need for additional real estate development to meet the needs of that industry. Shift share analysis puts that growth into context by comparing regional growth to overall national growth trends. As a result, you can see if growth rates are higher or lower than the national average and identify potential regionally competitive industrial trends.
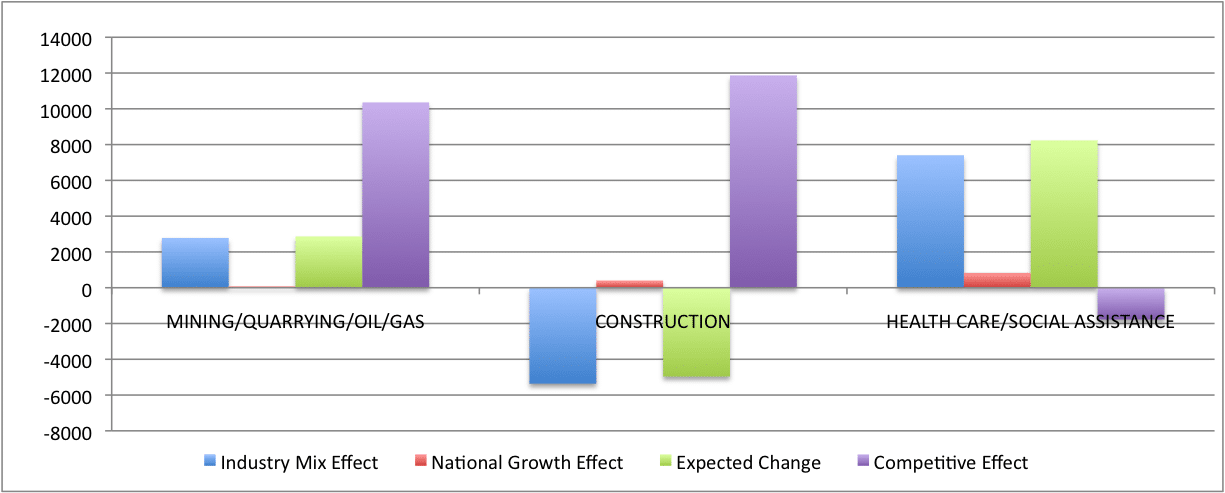
The table above illustrates how shift share analysis may be used to identify trends in three of a region’s major industries. National growth represents the effect of overall growth of the U.S. economy during a given time period on the regional economy. The industry mix effect represents share of regional growth explained by the national growth rate for the particular industry. The expected change is the difference between the national growth rate of the particular industry and the overall national growth effect. In this example, the national growth effect is relatively small. Both the health care and mining/quarrying/oil/gas industries are growing at a much faster rate than the overall national economy. The construction industry, however, is experiencing a decline.
The regional competitive effect takes the regional growth in a particular industry and then subtracts the industry’s national growth rate. In this example, the mining/quarrying/oil/gas industry performed better than the overall national economy. The industry in this region performed even better than average for the country, and the shift share analysis indicates this is a regional competitive advantage. Even though the construction industry did not perform well at the national level during this time period, the industry in this region did not experience as large of a decline as the national average. As a result, construction appears to be a regional competitive advantage even though the industry overall experienced a decline. Even though health care and social assistance was a high growth industry at the national level, this region experienced growth below the national average. Having a regional competitive effect value less than zero indicates that health care is a lagging industry for this particular region.
How to Create a Shift Share Analysis Step by Step
We will walk through an example below, but at a high level here are the general steps required in order to create a shift share analysis:
- Select the time frame and the local area you want to study
- Calculate the national growth share by applying the national growth rate to the industry categories of the local area
- Calculate the industry mix effect by comparing the national overall growth rate to the national industry category growth rate
- Calculate the regional shift net effect by comparing the national industry category growth rate to the local industry category growth rate.
Where to Get Data For a Shift Share Analysis
Data necessary to perform a shift share analysis is easily accessible online through a variety of federal and state government resources. Annual employment data by industry is available from the U.S. Census Bureau’s annual County Business Patterns data publication. The U.S. Bureau of Labor Statistics also publishes employment data broken down by industry at both the state and county level in its Covered Employment data series.
The size of the area you choose at your local region can be as small as a census tract, but it may be more difficult to get detailed industrial information using such a small area. The region you analyze as the local economy should, however, represent a reasonable market area for a particular piece of real estate since potential tenants will be drawn from the market in that region. As a result, the local region may be a larger metropolitan area, county, region (several counties), or even the entire state.
You can easily download Quarterly Census of Employment and Wages data for specific areas or industries using the single screen or multi-screen data tool located here:
https://www.bls.gov/cew/data.htm
Choose the U.S. total, state or MSA of interest along with industrial code, government or private employment, and all employees.
To download the data for all areas and industries in one step, follow this link:
https://www.bls.gov/cew/datatoc.htm
Click on the link for the Excel file at the county high level to download all data files for a specific year.
Shift Share Analysis Example
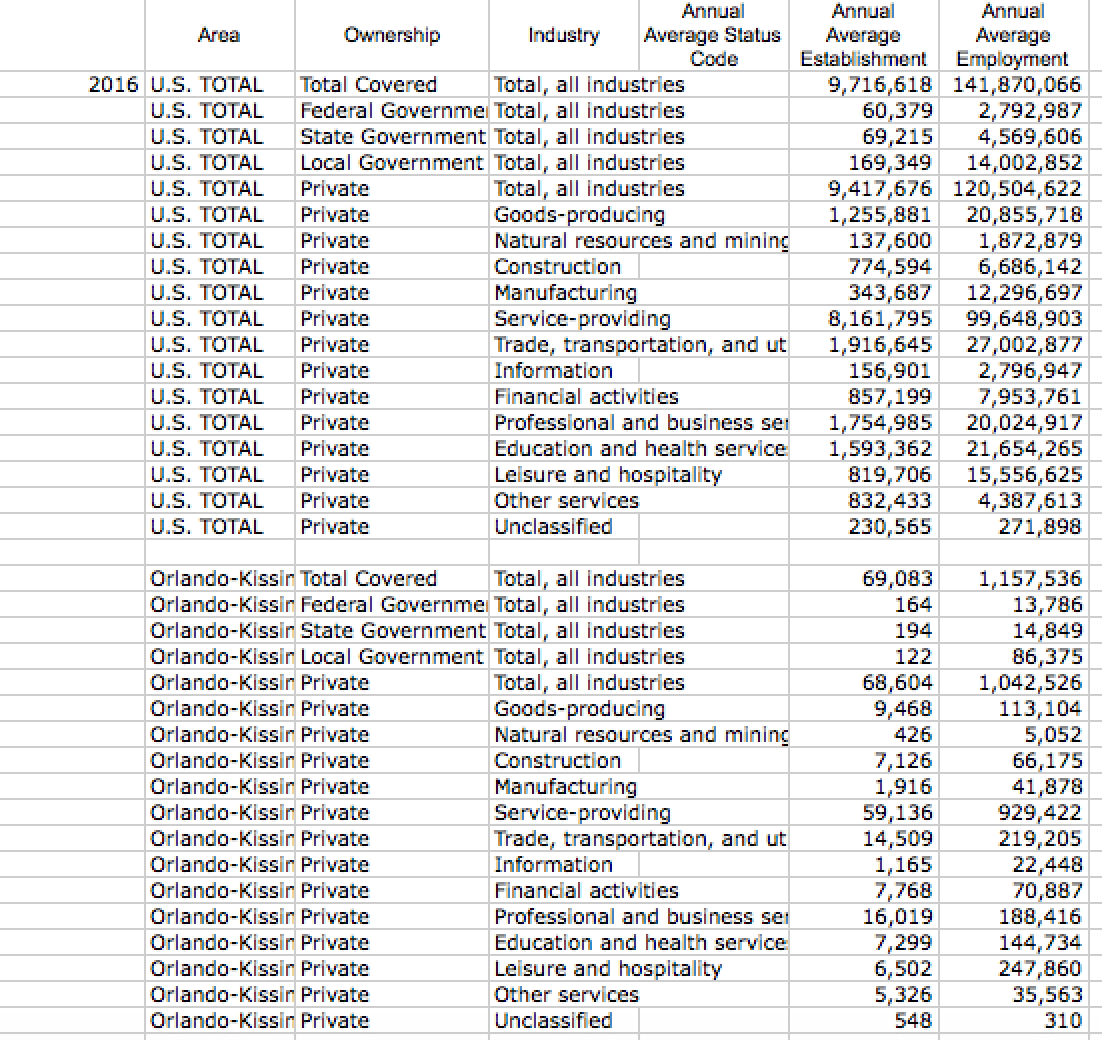
First, using the links above, download the Covered Employment data from the U.S. Bureau of Labor Statistics for the entire United States. Second, download data for the county or metropolitan area of choice. This example uses the Orlando-Kissimmee, Florida MSA.
A shift-share analysis compares changes in industry growth over time. This example uses the 2015 and 2016 annual data on annual average employment by industry. This is the raw data collected for the year 2016.
Next, use the total covered U.S. national employment to estimate overall national economic growth from 2015-2017. In this example, the national growth in the number of jobs is 1.7%.
Now that we have our data and the overall national growth rate, we can calculate the components of the shift share using the following equations:
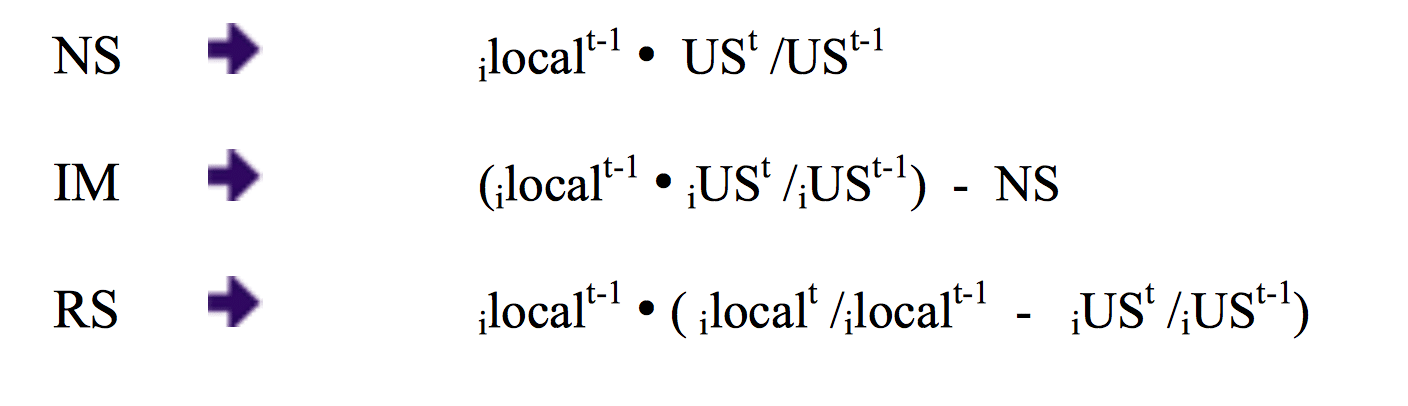
The first component is the national shift component. Take the ratio of total U.S. employment in 2016 and divide by total U.S. employment in 2015 to get the total national employment growth ratio (1.017). Then multiply that ratio by the local industry employment in 2015 for each individual industry component. Compute this value for each industry in the analysis.
To calculate the industry mix effect, you’ll need to look at the national level growth of employment in each industry between 2015 and 2016. For each industry in the analysis, compute the ratio of U.S. total industry employment in 2016 divided by U.S. total industry employment in 2015. Multiply that national industry growth ratio by the local industry employment in 2015. Finally, subtract out the national shift effect component calculated in the first step. What is left is the industry mix effect. Compute this value for each industry in the analysis.
Finally, compute the regional shift effect or regional competitive advantage. To do this you need to start with the ratio of regional industry growth in 2016 divided by regional industry growth in 2015. Do the same thing for the industry employment values. Divide the industry employment in 2016 by the industry employment in 2015. Then, subtract the national industry growth ratio from the regional industry growth ratio. Finally, multiply this times the 2015 local industry annual average employment. This calculation is the regional competitive effect. Compute this value for each industry.
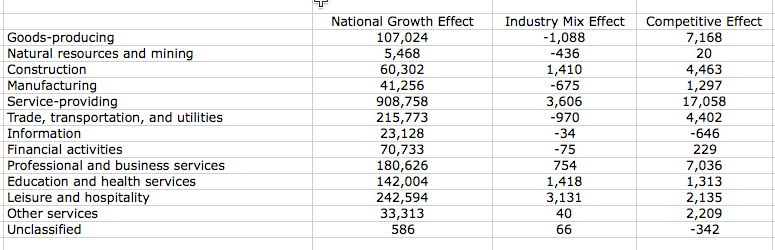
Here is an example of the completed shift share calculations for the years 2015-2016. The Orlando-Kissimmee, Florida MSA exhibits a strong regional competitive effect in goods-production overall, and specifically in construction and manufacturing. It also has a strong regional competitive effect in service-providing categories overall and specifically in trade and transportation, professional and business services, education and health services, and leisure and hospitality. The area has a negative regional competitive advantage, or a market disadvantage in the areas of information and unclassified employment.
Fill out the quick form below and we'll email you the completed shift share analysis example used in this article.Shift Share Analysis Example
Conclusion
Shift share analysis is a useful tool in a real estate market analysis because data is readily available and the technique is fairly simple. You can get a clear picture of overall national economic growth trends as well as the performance of individual industries at both the national and local level. In order to forecast real estate prices, population growth and demand, rental rates, vacancy rates, lease-up periods, and growth rates, the market analysis needs to provide information about how the regional trends compare to national trends. Shift share analysis does that.
On the other hand, it is also important to note that the growth rates calculated in a shift share analysis provide a snapshot of past growth. These past growth rates provide insight into the impact of specific industries within a region as well as which industries might provide unique growth opportunities for real estate and economic development in the area. Further analysis and consideration, however, needs to be placed on the drivers behind the results of the shift share analysis. In addition, real estate analysis involves forecasting future trends. Past data may be useful in creating a base trend, but you need to consider if those past growth rates are representative of future expectations given all the information currently available about the market.
In conclusion, shift share analysis is a relatively simple and useful tool to include in a real estate market analysis. The results, however, should not be taken alone and are most helpful when considered in the context of the larger picture presented by the entire market analysis.