
The capitalization rate, or cap rate, is calculated by dividing a property’s annual net operating income by its purchase price or market value. Commercial real estate professionals use it to compare income-producing properties and estimate what they are worth.
A building with $140,000 in annual net operating income and a $2 million price, for example, has a 7% cap rate. Deciding whether that is an attractive price takes more work. You need to understand where the income figure came from and how the property compares with others on the market.
We’ll use a hypothetical commercial building to work through the calculation and valuation, then look at what financing and a tenant vacancy do to the investment. We’ll also see why the same building can have more than one quoted cap rate.
Jump to: Formula · How to calculate cap rate · Valuation · What is a good cap rate? · Comparing returns · Advanced methods · FAQs
What Is a Cap Rate?
A cap rate expresses one year’s net operating income as a percentage of the property’s price or value. To calculate it, divide annual NOI by the purchase price or market value:
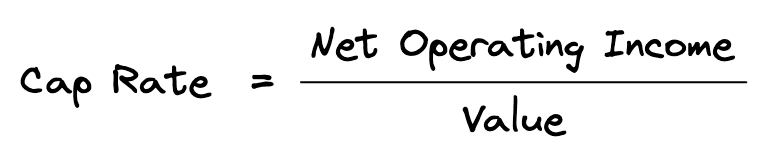
Net operating income, usually shortened to NOI, is the income remaining after accounting for the expenses of operating the property. It is calculated before mortgage payments and the owner’s income taxes.
Suppose a small commercial building is offered for $2 million and is expected to produce $140,000 in NOI over the next 12 months. Its cap rate would be:
$140,000 ÷ $2,000,000 = 0.07, or 7%
The result is 0.07, which we express as a 7% cap rate. In other words, the building is expected to produce $7 in annual NOI for every $100 of purchase price.
A 7% cap rate does not mean you will earn a 7% total return. Mortgage payments and capital expenditures affect the cash available to you, while future income and the eventual sale affect what you earn over the holding period. We’ll come back to those differences below.
How to Calculate a Cap Rate
You only need two numbers to calculate a cap rate: annual NOI and a property price or value. Once you have them, you divide NOI by value and express the result as a percentage. Of course, the harder part is coming up with figures you can reasonably support.
Let’s return to our $2 million building. Suppose the listing broker advertises it at an 8% cap rate, even though our estimate of next year’s income suggests 7%. To understand the difference, we’ll work through our NOI estimate and then compare it with the income used in the listing.
1. Calculate the property’s NOI
First, we need to estimate the income remaining after operating expenses. We’ll project the next 12 months of rental income, reimbursements, and other income, then subtract an allowance for vacancy and collection losses and the property’s operating expenses:
| Income and expenses | Annual amount |
|---|---|
| Potential rental income | $240,000 |
| Expense reimbursements and other income | $40,000 |
| Less vacancy and collection losses | ($10,000) |
| Effective gross income | $270,000 |
| Less operating expenses | ($130,000) |
| Net operating income | $140,000 |
The property has $280,000 of potential rental income, reimbursements, and other income. After the $10,000 allowance for vacancy and collection losses, we expect to collect $270,000. Subtracting $130,000 in operating expenses leaves $140,000 in NOI.
Operating expenses include property taxes, insurance, management, routine repairs, and utilities. Mortgage principal and interest, depreciation, the owner’s income taxes, and capital improvements are excluded from this calculation.
Before relying on that estimate, we can check it against the leases and operating records. The rents should agree with the leases, and the reimbursements should reflect the expenses tenants are responsible for paying. We should also review property taxes, insurance, and management costs to see whether the projection reflects what a buyer can reasonably expect.
For example, suppose a $10,000 annual operating expense had been left out of the projection. Including it would reduce NOI from $140,000 to $130,000. At the same $2 million price, the cap rate would fall from 7% to 6.5%, even though nothing about the building had changed.
A note on reserves: Our examples calculate NOI before replacement reserves. Lenders typically deduct a reserve in their NOI calculations, and the OCC’s underwriting definition also recommends doing so. When comparing cap rates, make sure to check that all net operating income figures use the same methodology.
2. Identify which NOI is being used
Now we can return to the broker’s advertised 8% cap rate. If the asking price is still $2 million, that rate implies $160,000 in annual NOI. Our projection came to $140,000, so we need to find out what accounts for the additional $20,000.
Suppose a review of the property’s records and the seller’s projections gives us three income figures. The building earned $120,000 over the past year, recent leasing supports our $140,000 estimate for next year, and the seller expects $160,000 after completing improvements and re-leasing space:
| Income basis | Annual NOI | Cap rate at $2 million |
|---|---|---|
| Trailing 12-month actual income | $120,000 | 6.0% |
| Next 12-month projected income | $140,000 | 7.0% |
| Projected income after improvements and re-leasing | $160,000 | 8.0% |
This explains the advertised rate. The broker is using the $160,000 proforma NOI from the improvement plan, while our 7% calculation uses the $140,000 expected over the next 12 months. A buyer looking at the trailing 12 months would calculate 6%. Each calculation describes the income used, but the three rates are not interchangeable.
Before relying on the $160,000 projection, you would need to understand the proposed improvements, what they cost, and when the new leases could begin. The advertised 8% rate is based on income from a plan that still has to be carried out.
Forward NOI identifies a future period, such as the next 12 months. Stabilized NOI describes income at sustainable occupancy and operating levels. A forward projection can also be stabilized, but next year’s income is not automatically so. Stabilized income does not necessarily assume that every space is occupied, either.
For the valuation examples that follow, we’ll use $140,000 as sustainable next-year NOI in the building’s current condition. The seller’s $160,000 improvement plan will remain a separate assumption.
3. Divide by the relevant price or value
With the NOI selected, we can calculate the cap rate at the price we are evaluating. Our $140,000 estimate produces a 7% cap rate at the $2 million asking price, but a different offer price will produce a different rate.
For example, suppose you negotiate the purchase price down to $1.9 million. Keeping NOI at $140,000, the calculation becomes:
$140,000 ÷ $1,900,000 = Approximately 7.37%
The cap rate rises to about 7.37% because you are paying less for the same income. The change comes from the purchase price, not an improvement in the building’s operations.
Our free cap rate calculator can help you test another income figure or purchase price, but make sure to use a consistent NOI basis when comparing the results.
Is price the same as value?
Not necessarily. A seller’s asking price is what the seller hopes to receive, while a sale price is what a buyer and seller actually agree to. Market value is an opinion of the most probable price the property would bring under specified market conditions as of a particular date. The asking price, sale price, and appraised market value can differ.
When evaluating a purchase, dividing NOI by the asking price tells you the cap rate at that price. It does not establish whether the price is supported by the market.
To see the difference, consider an alternative to our 7% base case. Suppose the building still has $140,000 in NOI and a $2 million asking price, but comparable properties support a market cap rate of 7.5%. Dividing the same NOI by 7.5% would indicate a value of approximately $1.87 million. The 7% cap rate calculated from the asking price would still be mathematically correct. It would describe the seller’s price, not establish the property’s market value.
Appraisers also derive cap rates from comparable sale prices. They evaluate those transactions as market evidence, checking the income figures and any unusual sale terms before selecting a rate to apply to the property being appraised. Using a sale price in the formula is therefore part of appraisal practice, not just something investors and brokers do.
Using a Cap Rate to Estimate Property Value
To estimate value rather than simply describe an asking price, we need to select a market cap rate that fits the property. Once that rate is supported, we can use it to convert annual NOI into an indicated value:
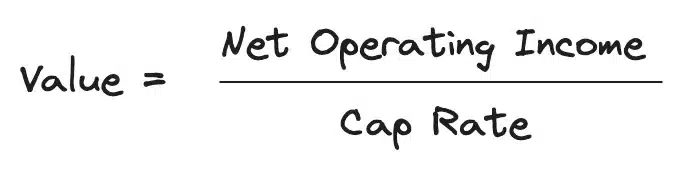
This method is called direct capitalization. It is an established valuation method, particularly for properties with stabilized income, and depends on both a supportable income estimate and a market cap rate that fits the property.
Returning to our main example, suppose market evidence supports a 7% cap rate for the building. Applying it to the $140,000 NOI gives us an indicated value of $2 million:
$140,000 ÷ 0.07 = $2,000,000
The question is how to support that 7% rate independently of the asking price. Recent sales of similar properties can help us decide whether it fits our building.
A comparable-sales example
One way to find that evidence is to examine recent sales of comparable properties. We calculate each sale’s cap rate using NOI and the sale price, then look at the differences between the properties to decide which comparisons deserve the most weight.
Suppose we verify the following three sales in the same submarket. To keep the comparisons consistent, each NOI figure represents forward, stabilized income before replacement reserves:
| Sale | Sale price | Annual NOI | Cap rate |
|---|---|---|---|
| A | $2,400,000 | $156,000 | 6.5% |
| B | $2,200,000 | $154,000 | 7.0% |
| C | $1,800,000 | $135,000 | 7.5% |
For each sale, we use the income that could reasonably have been expected when the transaction occurred. Dividing a property’s current NOI by a sale price from several years ago would not tell you the cap rate at which it sold.
Looking more closely, we find that Comparable A has longer remaining leases at market rents, while Comparable C is older and has shorter leases. Comparable B is the closest match to our building in both condition and lease profile.
These sales suggest a range of 6.5% to 7.5%, with 7% a reasonable working assumption because Comparable B is the closest match. That happens to be the average, but we are choosing it because of the property comparison, not the average alone.
An actual valuation would also require a closer review of transaction dates, location, tenant quality, occupancy, and unusual sale or financing terms. The lease differences above help explain this example; they do not establish a fixed adjustment for every building.
Published surveys can help put the sales in context. CBRE’s cap rate survey, for example, provides estimates informed by transactions and market discussions. Those estimates are a useful reference, but still need to be considered alongside the property and its comparable sales.
What about the seller’s higher NOI forecast?
Dividing the seller’s $160,000 NOI forecast by 7% gives a value of approximately $2.29 million. That describes a property earning the projected income after the improvement plan, not necessarily the building being offered today.
An acquisition analysis would need to account for the cost of the improvements, the time required to complete the work and sign leases, and the risk of falling short. We would also need to support the cap rate used for the improved property.
How Cap Rates Affect Property Value
Holding NOI constant, cap rates and property values move in opposite directions. At a higher cap rate, the buyer requires more income for each dollar of price and therefore pays less for a given NOI. Here is how that affects our building:
| Market cap rate | Value at $140,000 NOI |
|---|---|
| 6.0% | $2,333,000 |
| 6.5% | $2,154,000 |
| 7.0% | $2,000,000 |
| 7.5% | $1,867,000 |
| 8.0% | $1,750,000 |
A move from a 7% cap rate to 7.5% reduces indicated value from $2 million to about $1.87 million. That increase of 50 basis points, or 0.5 percentage point, cuts value by approximately $133,000, or 6.7%, with no change in NOI.
When market cap rates decline, the change is called cap rate compression. When they increase, it is called cap rate expansion. To understand what either change means for a particular building’s value, we also need to consider whether its NOI has changed.
Can income rise while value falls?
It can. Suppose our building’s NOI increases 5%, from $140,000 to $147,000, while the market cap rate rises from 7% to 7.5%. Applying the new rate to the higher income gives us:
$147,000 ÷ 0.075 = $1,960,000
Despite the 5% increase in NOI, value has fallen 2% from the original $2 million. The higher income partly offset the effect of the rising cap rate, but not enough to prevent a decline in value.
Thinking in income multiples
Another way to interpret a cap rate is as a multiple of annual NOI. Instead of measuring income relative to price, we ask how many times the annual income a buyer is paying:
NOI Multiple = 1 ÷ Cap Rate
Using the cap rate as a decimal, a 5% rate gives us 1 ÷ 0.05, or 20 times annual NOI. At a 10% cap rate, the multiple is 10 times NOI. The chart shows how the multiple falls as the cap rate rises:
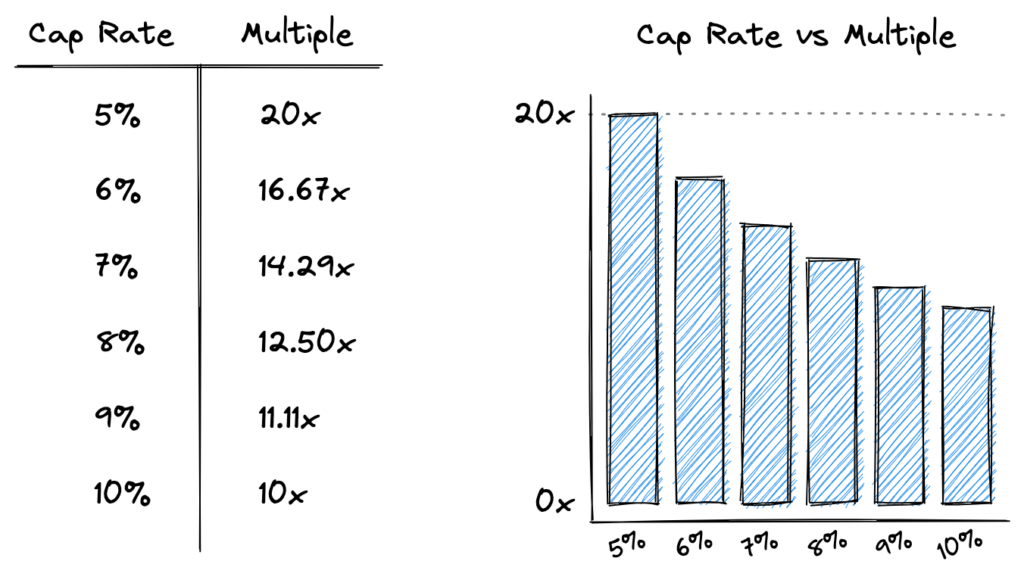
A 20-times multiple can sound like a 20-year payback period, but NOI is not necessarily the cash available to the owner. Income and expenditures can change, and eventual sale proceeds also affect the return. The multiple describes pricing relative to one year’s NOI, not the time needed to recover your investment.
What Is a Good Cap Rate?
There is no single cap rate that makes every investment attractive. The most useful starting point is to compare similar properties in the same market using consistent income assumptions, then investigate the reasons for any differences.
For a given NOI, buyers generally prefer a higher cap rate because it means a lower price. Sellers generally prefer a lower rate for the opposite reason. In either case, the income and the comparison still need to be checked.
Suppose comparable buildings sell around a 7% cap rate, but one is offered at 9%. Perhaps the seller needs a quick sale. Or perhaps the largest tenant is paying above-market rent on a lease that expires next year, leaving the buyer facing months of vacancy and substantial leasing costs.
Those are very different reasons for a high cap rate. Before treating the 9% property as a bargain, you would want to check the leases and expenses, investigate the comparable sales, and consider what happens to income after the first year.
A property bought for renovation and lease-up may have a low going-in cap rate because current income is weak. The buyer expects it to become more attractive after the work is complete, so the decision depends on the improvement plan and its costs rather than the initial cap rate alone.
What Determines Cap Rates?
Buyers consider more than a single year’s income when deciding what to pay. Tenant quality, remaining lease terms, building condition, local supply and demand, and expectations for future income all influence the cap rates they accept.
For example, two buildings may have the same NOI, but one has several years remaining on leases at sustainable rents. The other has leases expiring soon at rents above what replacement tenants would pay. Buyers may pay more for the first building because there is less uncertainty about maintaining its income.
Investors are also comparing real estate with other places they could put their money. When the returns available on bonds and other investments become more attractive, buyers may require a higher expected return from a property as well. If its expected cash flows have not changed, that generally means paying a lower price—and buying at a higher cap rate.
This helps explain why interest rates matter, but cap rates do not move with them one-for-one. Changes in expected rent growth, perceived risk, and investor demand can reinforce or offset the effect.
Expected growth affects this judgment even though it does not appear separately in the cap rate formula. The difference between a cap rate and a Treasury yield therefore cannot be attributed entirely to compensation for property risk. The Gordon model below helps explain this relationship.
When a Cap Rate Is Not Enough
A cap rate becomes less useful on its own when a single year’s NOI does not show an important change ahead. Consider two versions of our $2 million building, both expected to produce $140,000 in first-year NOI and therefore both offered at a 7% cap rate.
In Building A, the largest tenant has several years left on its lease. In Building B, that lease expires at the end of Year 1, creating uncertainty about income and leasing costs after that point.
Suppose Building B’s tenant leaves, reducing Year 2 NOI to $100,000. Tenant improvements and leasing commissions cost another $80,000 that year, leaving only $20,000 before financing. A simplified comparison of the two buildings would look like this:
| Year | Building A | Building B |
|---|---|---|
| 1 | $140,000 | $140,000 |
| 2 | $144,000 | $20,000 |
| 3 | $148,000 | $150,000 |
Building B has a substantial Year 2 shortfall despite starting with the same cap rate as Building A. The buyer needs to plan for that shortfall, and understanding its size and timing helps determine whether a lower purchase price is warranted.
A discounted cash flow analysis, or DCF, projects the cash flows over the holding period, including capital and leasing costs and eventual sale proceeds, then discounts them to present value. This makes the lease expiration visible in the years when it affects income and spending.
The OCC’s valuation guidance makes a similar distinction between direct capitalization of stabilized income and DCF analysis of properties with unstabilized occupancy or material income fluctuations.
The projection still depends on reasonable assumptions, but it shows when cash flow falls and when the leasing costs have to be paid. We can then test what happens if leasing takes longer or the tenant improvements cost more than expected.
Cap Rate vs. Cash-on-Cash Return and Other Metrics
So far, we have evaluated the building without considering the buyer’s financing. Cash-on-cash return includes that part of the investment by dividing annual before-tax cash flow by the cash invested:
Cash-on-Cash Return = Annual Before-Tax Cash Flow ÷ Total Cash Invested
Suppose you buy our building for $2 million using a $1.5 million loan. The loan carries a fixed 6.5% interest rate, with monthly payments and a 25-year amortization schedule.
Your down payment is $500,000. Adding $50,000 for closing costs brings the total cash invested to $550,000.
Annual principal and interest payments, or debt service, are approximately $121,537. Assuming no other first-year deductions below NOI, we subtract those payments from $140,000 and divide the remaining cash flow by the $550,000 invested:
Before-Tax Cash Flow = $140,000 − $121,537 = $18,463
Cash-on-Cash Return = $18,463 ÷ $550,000 = Approximately 3.4%
The property still has $140,000 in NOI and a 7% cap rate at the $2 million price. After accounting for the loan payments and cash needed at closing, however, the projected cash-on-cash return is about 3.4%.
The loan’s 6.5% interest rate is below the 7% cap rate, but that comparison leaves out the principal portion of the mortgage payments. Principal repayment reduces your loan balance without providing cash you can spend or distribute.
How the other return measures differ
The other common return measures also become easier to distinguish when you look at the cash flows and time period they use:
| Measure | What it tells you |
|---|---|
| Cap rate | One year’s NOI relative to property price or value. |
| Cash-on-cash return | One year’s before-tax cash flow relative to cash invested. |
| IRR | A percentage return calculated from the amounts and timing of investment cash flows. Usually presented as an annual rate. |
| Discount rate | The required return used to convert future cash flows to present value. |
| ROI | Total net gain relative to the amount invested, without inherently accounting for when cash flows occur. |
IRR can measure property cash flows before financing or equity cash flows after financing. A projected IRR uses a forecast, while a realized IRR uses actual cash flows. Before comparing two IRRs, check which cash flows each one measures.
These measures work together. Cap rate helps explain pricing, cash-on-cash return shows the annual cash yield on your investment, and a multiyear projection lets you evaluate cash flows and returns over the holding period.
Advanced Cap Rate Calculation Methods
Two additional methods explain how cap rates relate to financing and growth. The band-of-investment method uses the cash flow requirements of debt and equity, while the Gordon model connects required return with expected growth. Both depend on assumptions that fit the property and market.
Band of investment
What if there are few recent comparable sales, or none with reliable income information? Appraisers can use the mortgage–equity band-of-investment method to help estimate a market cap rate from financing terms and investors’ required cash yields. The method can also provide a check on a rate extracted from sales.
Instead of starting with a property’s sale price and NOI, the method combines the lender’s mortgage-payment requirement and the equity investor’s required cash yield. Each is weighted by the share of property value financed with debt or equity:
Cap Rate = (Debt Share × Mortgage Constant) + (Equity Share × Equity Capitalization Rate)
The mortgage constant is annual debt service divided by the loan amount. Unlike the interest rate alone, it includes the principal portion of an amortizing loan’s payments.
The equity capitalization rate, also called the equity dividend rate or cash on cash return, is annual before-tax cash flow divided by the equity investment. Here, we need the investor’s required annual cash yield, not a multiyear equity IRR.
For a separate example, suppose financing provides 80% debt at 6% interest, amortized over 20 years with monthly payments. The mortgage constant is approximately 8.60%. If investors require a 15% initial cash yield on the remaining 20% equity, the calculation is:
(80% × 8.60%) + (20% × 15%) = Approximately 9.88%
This implies a cap rate of approximately 9.88%. Equity here means the down payment portion of property value, with acquisition costs and other expenses below NOI excluded.
To use the result as a market cap rate, the inputs need to reflect typical market participants. Lender quotes and interviews can help establish available loan terms, while investor surveys and interviews can help support the required equity cash yield for similar properties. Choosing one buyer’s preferred loan and desired return would instead describe that buyer’s pricing requirement.
The method is useful when comparable sales are hard to find, but it still requires credible market evidence. If the loan terms or equity cash yield cannot be supported, the calculated rate will be uncertain as well. Where reliable sales evidence is available, compare it with the band-of-investment result.
The Gordon growth model
The Gordon growth model approaches the question through expected growth in cash flow. It calculates the present value of a cash flow that grows at a constant rate indefinitely:
Value = Next Year’s Cash Flow ÷ (Discount Rate − Growth Rate)
To connect this with the cap rate, suppose NOI is the relevant property cash flow. If we use that same next-year NOI in the direct capitalization formula, the two formulas give the same value when:
Cap Rate = Discount Rate − Growth Rate
Suppose an investor requires a 9% return and expects cash flow to grow by 2% annually indefinitely. The implied cap rate is 7%, giving the following value for $140,000 of next-year income:
$140,000 ÷ (9% − 2%) = $2,000,000
The 7% cap rate is consistent with the 9% required return because part of the expected return comes from growth. This explains how a property can trade at a cap rate below the total return an investor expects.
This assumes constant growth indefinitely, a discount rate greater than growth, and cash flow that allows for the costs of sustaining the property. The last condition matters when using NOI before capital expenditures: not all NOI is available to the investor if the property also needs capital spending.
The formula also uses next year’s income. As Aswath Damodaran explains in his real estate valuation chapter, using current-year income changes the relationship. The Gordon model is useful for understanding how return and growth relate to value, provided the cash flow actually fits its assumptions.
Cap Rate Frequently Asked Questions
A 7.5% cap rate means annual NOI equals 7.5% of the price or value used in the calculation. For a property priced at $2 million, that would be $150,000 in annual NOI. The investor’s cash-on-cash return or total return would require a separate calculation that accounts for the relevant cash flows.
The going-in cap rate, also called the acquisition cap rate, describes annual property income relative to the acquisition price. It commonly uses expected first-year NOI. When someone quotes a going-in rate, confirm which income figure they used, since the label alone does not tell you whether it is based on actual or projected income.
No. The NOI used in a cap rate calculation is measured before debt service, so changing your loan terms does not change the cap rate when NOI and price remain the same. It does change the cash flow available to you after making the mortgage payments.
An exit cap rate, also called a terminal or reversion cap rate, is used to estimate the sale price at the end of a holding period. In a typical DCF, it is applied to projected NOI for the year following the sale.
For example, suppose you plan to sell at the end of Year 5. If Year 6 NOI is projected at $160,000 and the assumed exit cap rate is 7.5%, the estimated sale price is:
Estimated Sale Price = $160,000 ÷ 0.075 = Approximately $2.13 million
That is the estimated gross property sale price. Selling costs and any outstanding debt still need to be deducted to calculate proceeds to equity. The exit cap rate should reflect the property’s expected condition and market outlook. Testing a range of rates is more useful than automatically adding a fixed amount to the going-in cap rate.
Not necessarily, because the two calculations may use different costs. Stabilized NOI divided by the purchase price is different from stabilized NOI divided by the total cost of acquiring and improving the property.
In our example, $160,000 divided by a $2 million purchase price is 8%. If reaching that income requires another $200,000, the yield on the combined $2.2 million cost is about 7.27%, before any other acquisition or project costs.
The terminology can vary. CBRE’s survey methodology, for example, defines its value-add cap rates using acquisition price plus value-add capital. Before comparing a quoted rate with your calculation, check which costs are included.
Yes. Cap rates can be used for income-producing houses, duplexes, and apartment buildings. The calculation uses rental income after operating expenses and an allowance for vacancy, just as it would for other investment properties. An owner-occupied home without rental income does not have an operating income stream to use in a direct cap-rate calculation.
It can. If NOI is negative and the property’s value is positive, dividing one by the other produces a negative cap rate. That does not mean the property has a negative value; it means current operations do not support the usual positive-income capitalization calculation. You would need to investigate future income potential, the expenditures required to achieve it, and other evidence of value.
Cap Rate Cheat Sheet
Fill out the quick form below and we’ll email you our free cap rate Excel cheat sheet containing helpful calculations from this article.
Putting Cap Rates to Work
Our building’s 7% cap rate was easy to calculate. Understanding the broker’s advertised 8% required a closer look at the income forecast, and the financing and lease-expiration examples showed why neither rate told us what cash would reach the owner.
Start with the income and price behind a quoted rate, then check the operating assumptions and comparable sales. That provides a sound basis for a direct capitalization valuation and helps identify when a more detailed cash flow analysis is needed.
When lease expirations, improvements, or financing materially change the cash flows, a multiyear proforma lets you work through their effects. PropertyMetrics Proforma lets you model those assumptions and compare scenarios as you evaluate the investment.