The breakeven occupancy ratio is one of the less frequently used ratios in commercial real estate, yet it’s also one of the most practical and useful ratios to know. It’s also especially important to lenders when underwriting investment commercial real estate loans. In this short article we discuss how the breakeven occupancy ratio works, why it’s important, and then we tie it all together with a clear example.
Breakeven Occupancy Ratio
First of all, what is the breakeven occupancy formula and how is it calculated?
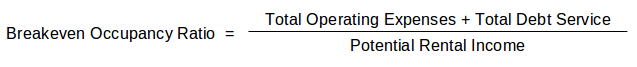
As shown above, the breakeven occupancy ratio is simply the sum of all operating expenses and debt service, divided by total potential rental income. This tells you what percentage of the property must be leased in order to cover all expenses and debt service obligations.
Breakeven Occupancy Example
Consider the following 5-year proforma for an apartment building:
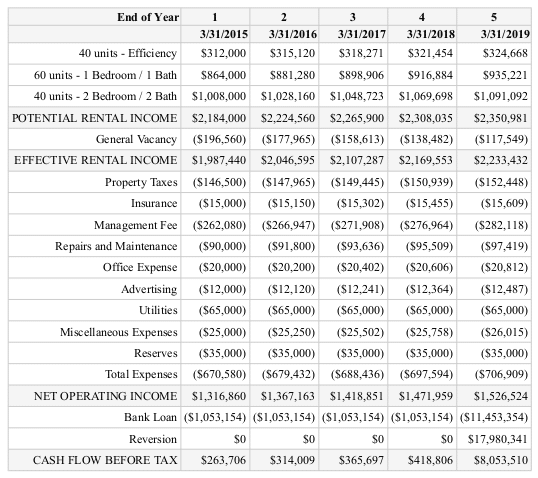
As shown above in year 1, the total operating expenses for this property amount to $670,580 and the total debt service is $1,053,154. Adding these two figures together equals $1,723,734, and dividing this total into gross potential rent of $2,184,000 results in a breakeven occupancy ratio of 78.9%.
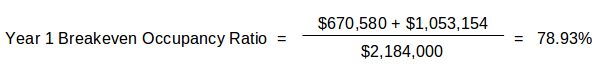
What does this breakeven occupancy of 78.9% tell us? Essentially, this particular property must be at least 79% occupied in order to satisfy all ongoing expense and debt service obligations. In other words, the vacancy rate on this property can go up to about 21% and we’ll still be able to continue paying all bills and loan payments on time.
Is this breakeven occupancy ratio good or bad? As always, it depends on the context. For example, if a lender was underwriting this property and calculated a 98.9% breakeven occupancy, it would then be compared to the market vacancy rates for this property type. If the vacancy rate for multifamily properties in this particular sub-market was 10%, then a breakeven occupancy ratio of 79% would provide a more than adequate cushion to protect against a higher than average vacancy rate.
On the other hand, if the market vacancy rate was closer to 15%, then the lender may want to look further into how the breakeven occupancy ratio changes over the holding period. Here’s how it looks in this particular example:
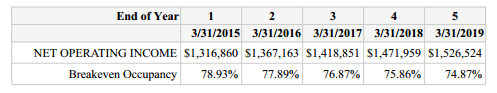
As shown above, the breakeven occupancy ratio steadily declines from about 79% in year 1 down to 75% in year 5. Perhaps this could be justified to the lender to provide an additional level of comfort regarding the deal.
Another way to think about the breakeven occupancy ratio is on a per unit basis. The above analysis simply computes a percentage of total potential rental income, but what does this mean in terms of actual units? The proforma shows a total of 140 units that generate an average of $1,300 in rent per month. That means in year 1 we can have up to 30 units vacant on average, and we’ll still breakeven. This provides us with a more tangible metric to track over time and allows us to raise a red flag once our vacant units cross a certain threshold.
Conclusion
The breakeven occupancy ratio is easy to calculate and provides a lot of insight into a deal. Knowing what your thresholds are in terms of actual units can also give you a tangible metric to track over time. Although it’s not the most popular commercial real estate ratio, breakeven occupancy should definitely be in your toolbox.